
Avery Patterson · 21 September 2026
Monitoring Engagement Shifts in Dynamic Online Ecosystems
Dynamic online ecosystems consist of platforms where content, algorithms, and user behaviors interact continuously, and researchers track engagement shifts through layered data collection systems that combine quantitative metrics with qualitative signals. Analysts at institutions such as the Pew Research Center compile longitudinal datasets on platform usage patterns, revealing how interaction rates fluctuate when interfaces update or new features roll out. These measurements rely on API integrations, session logs, and behavioral tracking tools that capture clicks, dwell times, and share volumes across social networks, forums, and content aggregators.
Core Metrics and Data Collection Practices
Engagement monitoring begins with standardized indicators including time-on-site, bounce rates, conversion events, and content interaction depth, yet experts expand these baselines by incorporating sentiment analysis from comments and real-time polling data. Organizations deploy machine learning models to process streaming information from multiple sources, and the resulting outputs highlight deviations from established norms within hours rather than days. Government statistical agencies in regions like the European Union publish aggregated reports through the Digital Economy and Society Index, which documents quarterly changes in digital participation across member states and supplies benchmarks that private analysts cross-reference with proprietary platform data.
September 2026 saw several platforms release updated recommendation engines that altered visibility distribution for user-generated material, prompting monitoring teams to adjust their sampling frequencies to capture immediate response curves. Data pipelines now ingest event streams at sub-second intervals, allowing teams to correlate algorithm tweaks with spikes or drops in active user counts. Observers note that combining server-side logs with client-side event tracking produces more complete pictures than either method alone, especially when ecosystems span mobile applications, desktop sites, and embedded widgets.
Analytical Approaches Used by Research Teams
Teams apply cohort analysis to segment users by acquisition date or behavioral cluster, then measure retention curves over successive weeks to isolate whether engagement declines stem from platform changes or external factors such as seasonal trends. Time-series decomposition separates cyclical patterns from structural shifts, while anomaly detection algorithms flag statistically significant departures that warrant deeper investigation. Academic studies from universities including Stanford have examined how network effects amplify small engagement changes into larger ecosystem movements, and these papers supply methodological templates that industry practitioners adapt for operational dashboards.
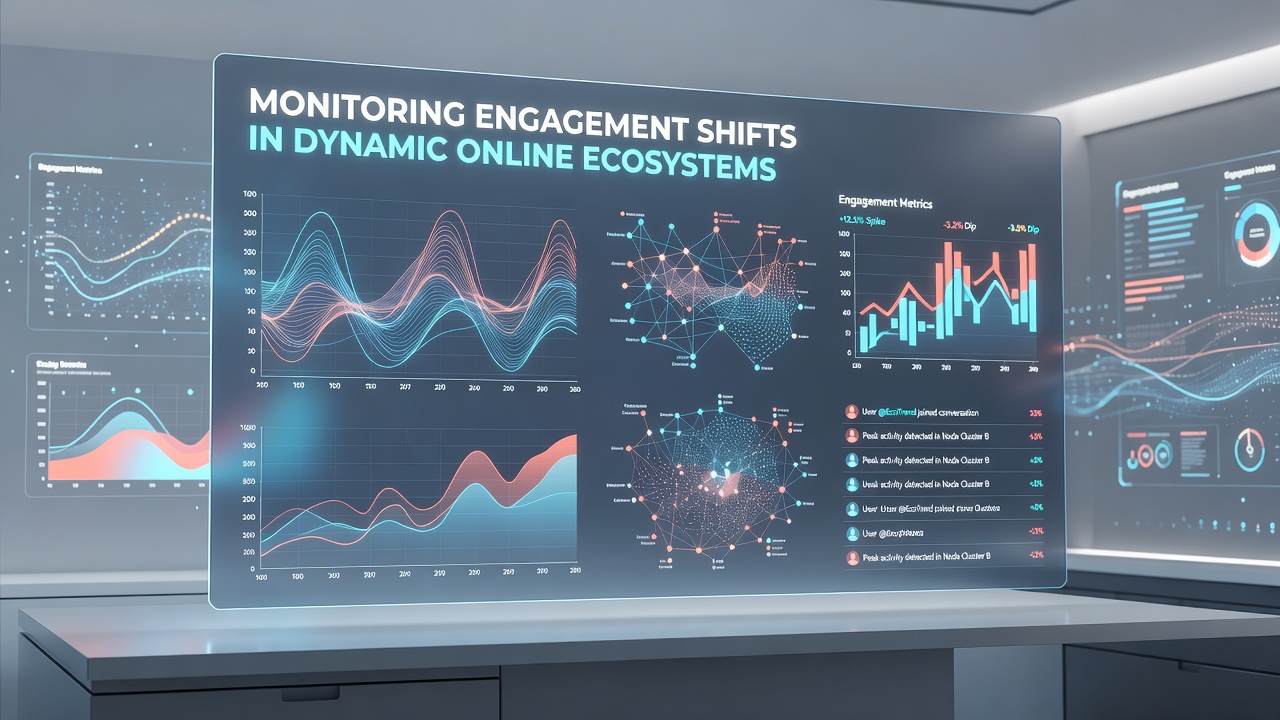
Visual mapping tools overlay engagement heatmaps onto network graphs, revealing clusters where interaction density rises or falls together. Analysts further validate findings through A/B testing frameworks that expose controlled user groups to variant experiences, generating causal evidence rather than correlational observations. When platforms introduce policy updates or content moderation adjustments, monitoring protocols expand to track downstream effects on discussion volume and cross-platform migration rates.
Integration of External Data Sources
Monitoring programs augment internal metrics with publicly available datasets from bodies such as the Australian Communications and Media Authority, which releases periodic surveys on digital content consumption habits across demographics. Cross-referencing these figures with platform telemetry helps distinguish between global shifts and localized variations tied to regional events or regulatory announcements. Industry reports from trade associations in gaming and digital media further contextualize engagement numbers by providing category-specific benchmarks that account for seasonal advertising cycles and major product launches.
Real-time dashboards now incorporate API feeds from multiple platforms simultaneously, enabling side-by-side comparison of engagement velocity across competing ecosystems. When one platform experiences an outage or feature restriction, analysts observe corresponding traffic surges on alternative services within the same vertical, documenting substitution effects that reshape overall user distribution. These observations feed into predictive models that estimate future engagement trajectories under various scenario assumptions.
Challenges in Maintaining Measurement Accuracy
Platform API changes frequently disrupt established data pipelines, requiring teams to rebuild connectors and revalidate historical baselines on short notice. Privacy regulations in multiple jurisdictions limit the granularity of user-level tracking, pushing analysts toward aggregated and anonymized datasets that preserve trend visibility while reducing individual resolution. Noise introduced by bots and automated accounts further complicates signal extraction, prompting deployment of filtering layers that rely on behavioral heuristics and device fingerprinting to isolate authentic human activity.
Multi-platform user journeys create attribution difficulties because individuals often maintain accounts across several services simultaneously, and single-source monitoring misses cross-ecosystem flows. Researchers address this by constructing identity graphs that link pseudonymous identifiers where permitted, then apply differential privacy techniques to protect user confidentiality while retaining aggregate insight value.
Conclusion
Effective monitoring of engagement shifts requires coordinated use of technical infrastructure, statistical methods, and external reference data that together provide timely visibility into evolving online ecosystems. Continued refinement of these approaches supports evidence-based decision making by platform operators, policymakers, and researchers who depend on accurate representations of user behavior dynamics. As ecosystems continue to evolve through algorithmic updates and regulatory developments, the frameworks described here supply the foundation for sustained observation and comparative analysis across time periods and geographic regions.